All gamers have experienced that frustrating plateau where improvement seems impossible. You practice daily, watch the pros play, yet your own performance remains at the same level. But what if breaking through comes not from more time spent in diligent practice because that hasn’t worked so far anyway – but instead smarter practice guided by data?
Gaming statistics have revolutionized how players approach improvement. Just as professional athletes use performance statistics to identify where they must improve and train their strengths, gamers now can employ detailed analytics in order to transform their gameplay. Whether you are trying to climb ranks in any competitive title or struggling with K/D ratios in Counter-Strike, gaming data may be your secret weapon. If you know how to understand and utilize it, of course.
The world of metrics and data might seem overwhelming for those who only start with gaming analytics. This guide will show you how to improve your gaming skills by systematically analyzing your game data, with practical examples that anyone can take immediate advantage of.
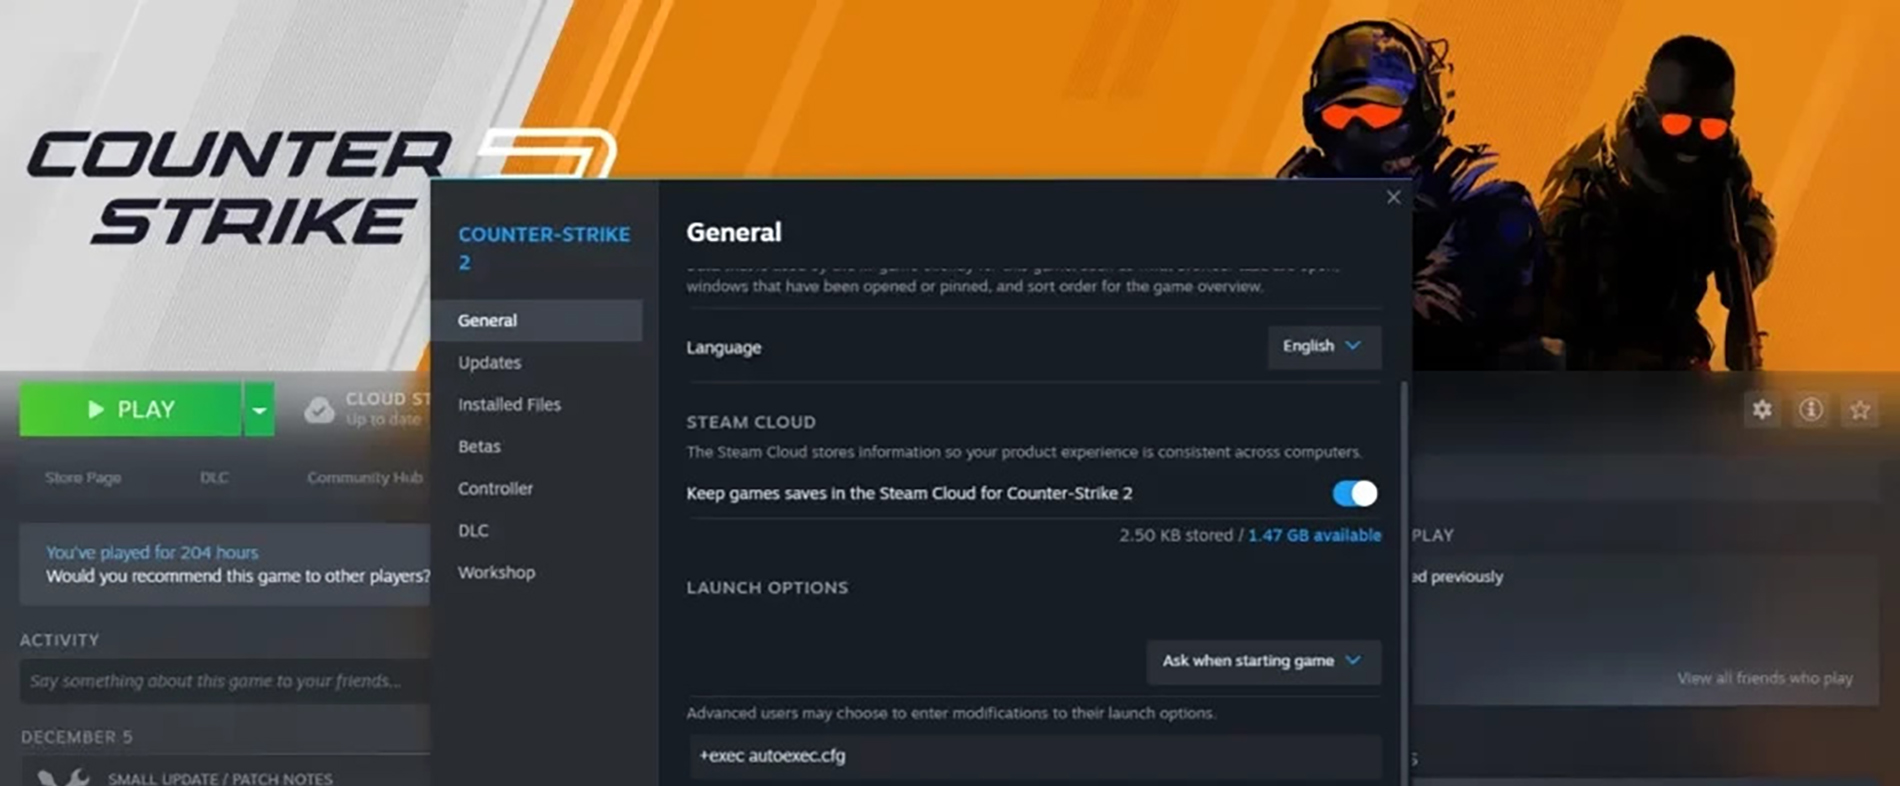
📊 What Data Is Collected By Analytical Tools
Modern gaming analytics tools bring rich data, with each item collected creating a part of your gaming performance picture. Taking good statistics means not only monitoring the basic kill/death ratio but tracking every facet of how one experiences a game – from system hardware and software performance all the way down to human behavior.
On the hardware side, the tool monitors your mouse DPI settings and actual usage, telling you whether you are really putting to use equipment’s full potential. It tracks keyboard response times and identifies your most-used keys, letting you modify keybinds efficiently in order to make them functional for what your mind and fingers want. Every mouse click is registered for both accuracy and speed; patterns of movement are plotted to give an overview of where your accuracy lies within various areas. Most importantly perhaps, reaction times in different settings are recorded with easy-to-understand figures – giving even the worst (or best) gamers concrete data upon which they can pay attention to.
When it comes to gaming performance stats, the system captures comprehensive gameplay metrics that differ from game to game. How long a session lasts and how frequently you play are two indicators that can help you identify when your peak times for playing are. The win/loss rate provides a big picture view of what kind of progress you’re making. In Counter-Strike specifically, this extends to round-by-round analysis that details exactly where matches are won or lost. Analytical tools can generate heat maps showing your positioning habits, which often expose weaknesses in strategy that players never identify in other ways. Economic efficiency tracking lets you know whether bad buy decisions are holding you back. And ability usage patterns and cooldown management data help optimize utility skills.
What is most interesting is the way that behavioral patterns translate into performance. It can identify your optimum gaming windows, and shows you when you’re naturally at your sharpest. Indicators showing fatigue based on declining metrics signal you to stop before bad habits take hold. Means for determining consistency across sessions illustrate whether you are steadily improving or going through volatile swings. All of this data is mixed together to show trends in improvement over time, sometimes with comparisons between average player data and your own performance than add even more context for your progress.
Quick Note on Data Collection
Real talk – the PLATFORM needs to know stuff about you to work its magic. It grabs the basics like your nickname and country (gotta show those regional promotions somehow). Your gaming setup details get logged too – which LORGAR mouse you’re rocking, what games you’ve installed, how fast you’re flicking that mouse around.
The technical stuff includes your IP and what apps you’ve got running – basically making sure the PLATFORM plays nice with your system and doesn’t suggest CS:GO settings while you’re in Minecraft. They also track how you use the PLATFORM itself because, honestly, how else would they know which features to improve?
The good news? They’re not creeping on your personal life. No questions about your politics, health stuff, or what you do on weekends. Just pure gaming data to make you better at clicking heads. Think of it as your gaming diary that actually helps you improve instead of just taking up space.
🕹️ How the Data You Collect Can Be Used to Improve Your Performance?
Understanding in game analytics opens up a world of opportunities for improvement, in essence an always-ready personal coach. The real value comes when raw data is turned into actionable changes in the way you play.
Pattern recognition is the true strength of analytics. You might discover that your accuracy drops by 15% after two-hour sessions, suggesting you need more frequent breaks. Perhaps the data reveals you consistently lose duels when holding certain angles on specific maps, indicating a need to adjust your positioning. Economy management issues often hide in plain sight until statistics show you’re forcing buys too often, costing crucial rounds. Map-specific performance data might reveal that your Mirage win rate is stellar while you struggle on Inferno, pointing to where practice time should be focused.
Instead of setting generalized goals, game activity metrics allow for precise, measurable objectives. Rather than just wanting to “improve your aim,” you can target increasing your headshot percentage from 35% to 45%. If entry fragging is your role, you might focus on reducing your average time-to-damage from 1.2 to 0.9 seconds. Consistency of performance in games can be improved through enduring longer sessions.
The beauty of data-driven improvement lies in objective progress tracking. After every practice session, measurable results will tell you exactly how to improve win rate using game data. If your training routine is effective, weekly performance trends will be so. Differences between your present stats and those of the past provide clear and unmistakable proof on improvement as well as direction toward areas needing further work. Comparing current stats to your baseline allows you to focus attention where it’s worth working rather than just what feels good along or following random hints from other players.
💡 Practical Application Examples
For CS Players:
- Heat maps show you’re over-peeking on T-side? Adjust your aggression
- Low utility damage? Practice grenade lineups
- Poor trade statistics? Work on team coordination
- Inconsistent spray patterns? Focus on recoil control drills
For MOBA Players:
- Low CS per minute? Practice last-hitting
- High death count in mid-game? Improve map awareness
- Poor objective control rate? Prioritize macro gameplay
For Battle Royale Players:
- Low survival time? Analyze drop locations
- Poor late-game performance? Study positioning data
- Inconsistent loadouts? Optimize loot routes
📈 Brief Overview of LORGAR PLATFORM Statistics
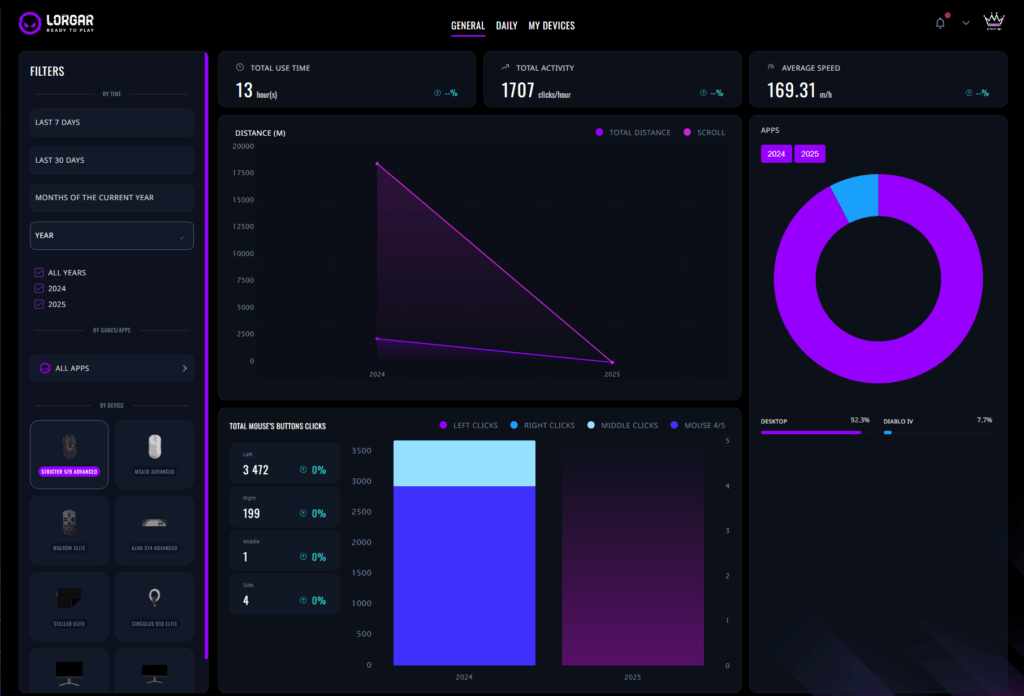
LORGAR PLATFORM‘s stats dashboard is where data nerds live. Open to the statistics tab and you are presented with an almost NASA-level command center.
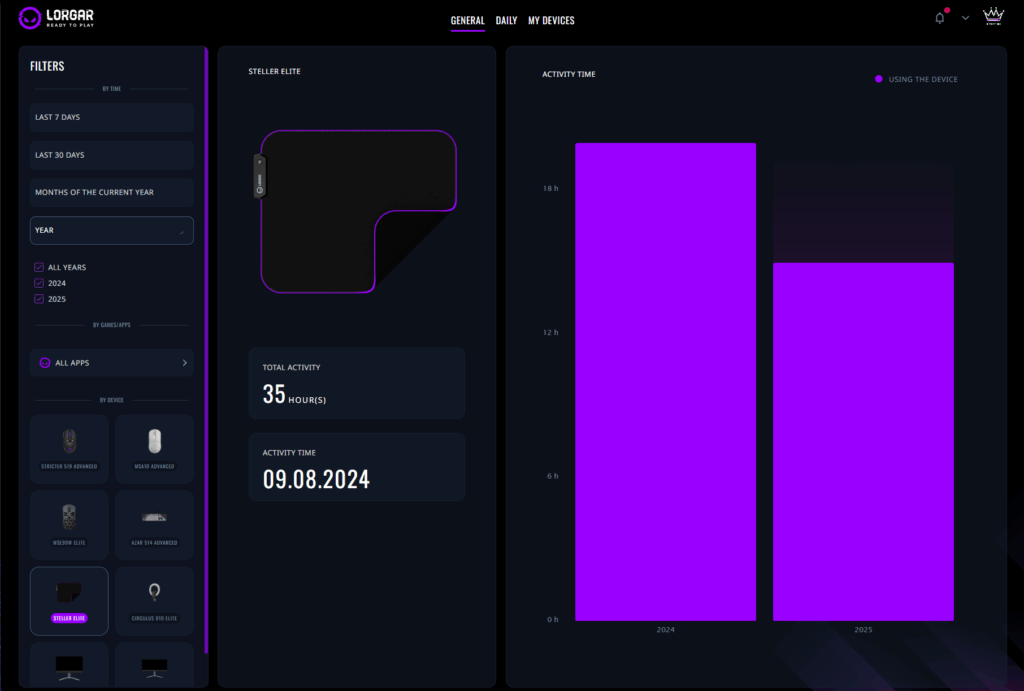
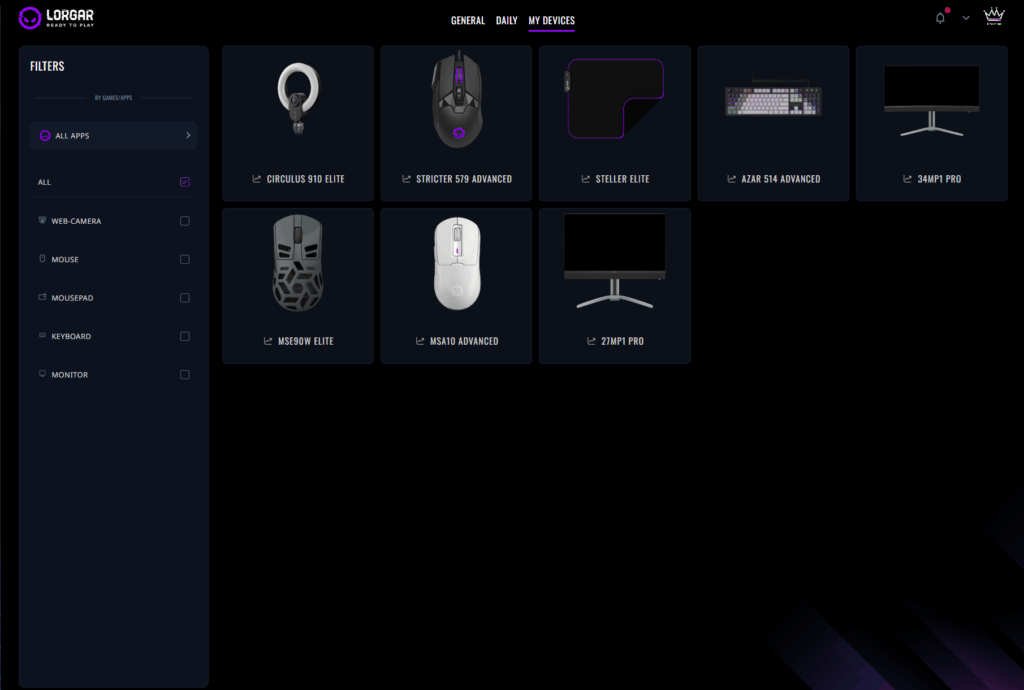
Analytics isn’t limited to just one connected device. Your mouse, keyboard and even your mousepad each have their own detailed profile with full data. Are you more effective with a certain piece of kit than with others? Which specific equipment contributes most to your overall stats? The answers are just a click away.
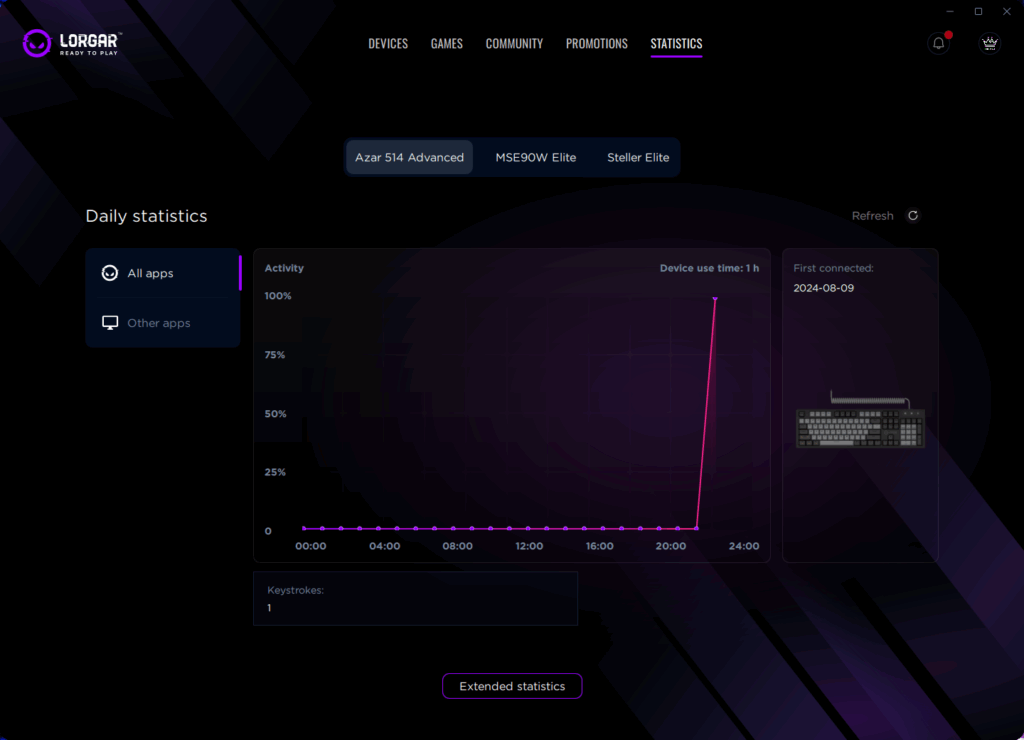
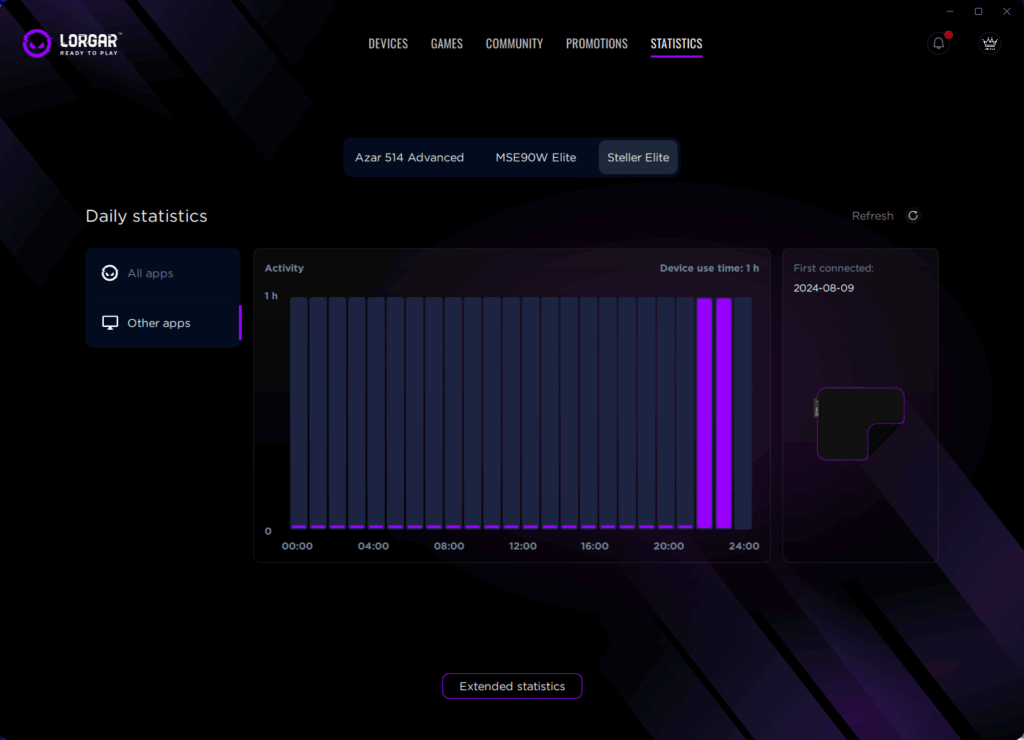
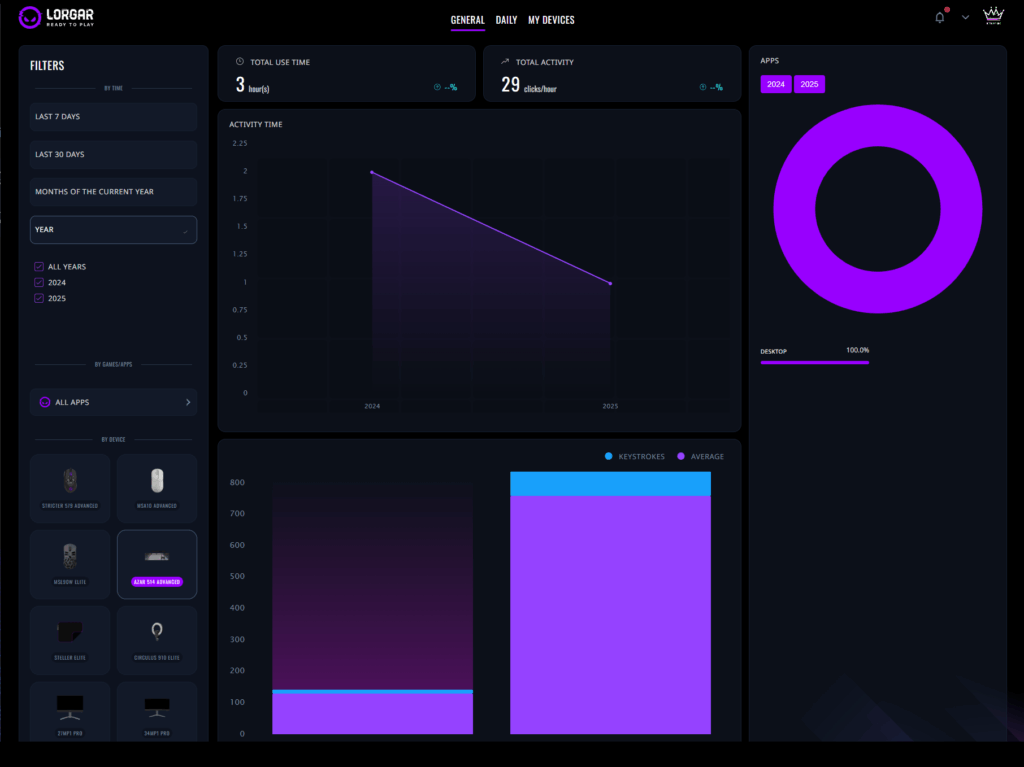
Daily Statistics view provides a snapshot of the big picture in moments. Hourly activity bars show exactly when you’re gaming instead of browsing around on other sites. That purple spike between 10 p.m. and midnight might be your prime time. As you can also see what proportion is pure gaming versus “other apps” – it tells on how wasteful we really are about employing any technology as a work tool.
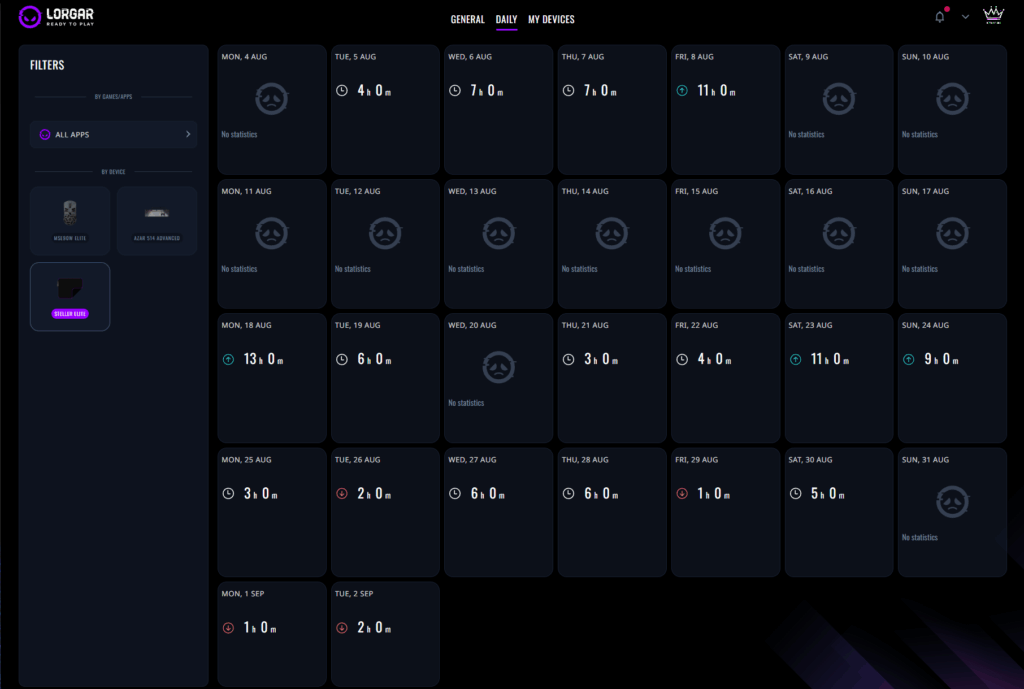
The real power lies in Extended Statistics (the browser view). This is where LORGAR PLATFORM goes from simple tracking to sophisticated gaming analytics tools. Long-term comparisons show how far you’ve come. Monthly calendars reveal patterns – regular daily sessions or weekend warrior blowouts. The distribution graphs for buttons tell you whether you’re using your hardware extensively or just hammering left-click.
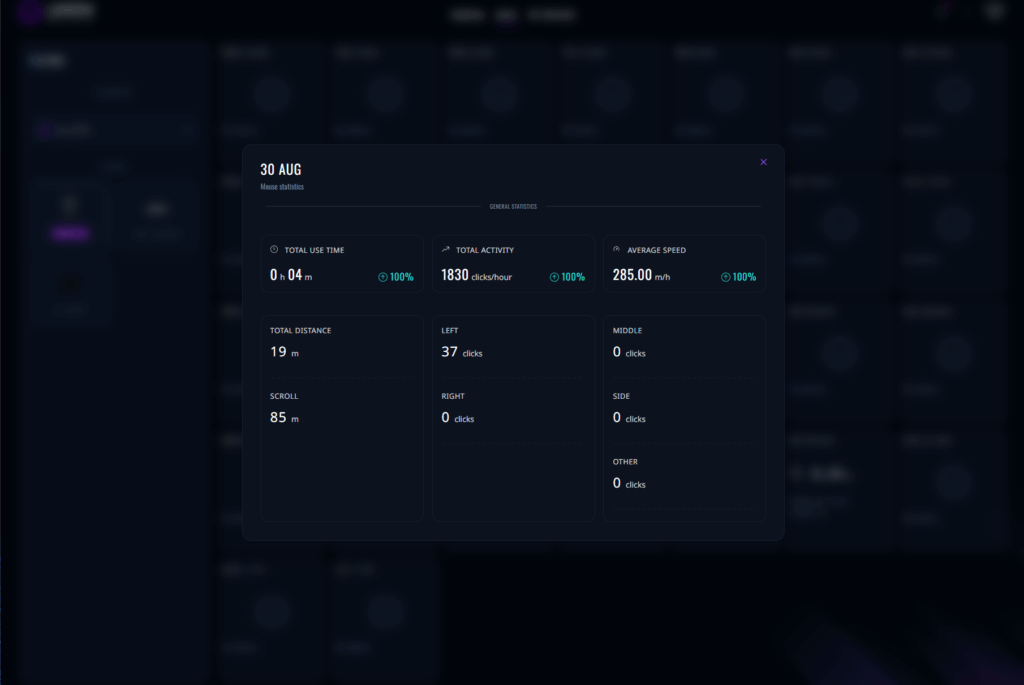
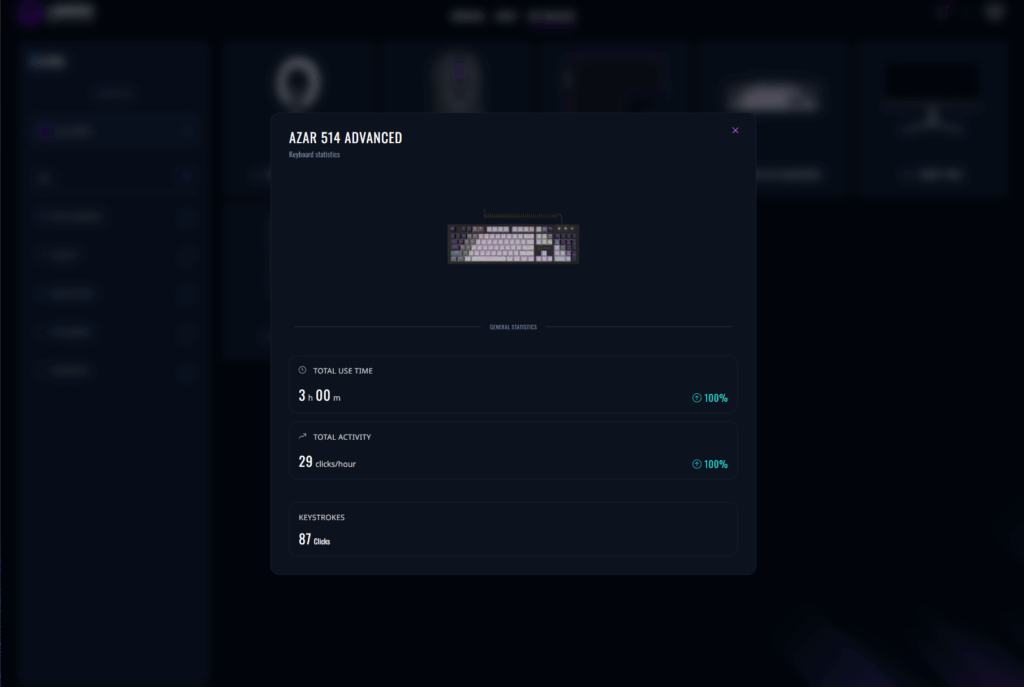
Device-specific insights are where things get detailed. For mice, see all button click distribution, scroll distance and movement speed trends. Keyboards show keypress quantity and per-session intensity. LORGAR PLATFORM even keeps track of LORGAR mousepad or monitor usage.
What sets LORGAR apart is the correlation capability. See a performance drop in your game stats? Find the PLATFORM data for that same period. Maybe your average speed was reduced showing signs of fatigue. Or click accuracy declined, implying it’s time to lower sensitivity. This cross-reference between hardware performance metrics and game data analytics leads to insights that are simply not possible to get elsewhere.
LORGAR PLATFORM updates in real time, so you can check how things are going mid-session. Find your aim is off today (not just you)? A quick statistics check might show that your clicking rate is 30% lower than average, which means it’s time to warm up. Or maybe the movement distance has been multiplied by two – clearly there’s some overcompensation here and we need to calm down.
📌 Conclusion
The space between casual and competitive gaming is narrowing, and gaming statistics are one of the most important reasons. Professional players have long had access to detailed analytics and coaching, but now these powerful tools can be used by anyone. Through data-driven improvement, anyone in the game can accelerate skill advancement and get better results. The answer to your question, “How to play better in CS?”, can be as simple as one word – analytics.
Beginning your adventure with tools doesn’t mean you have to start with every metric. Select one or two core numbers that match your present objectives. If you’re aiming, focus on accuracy and headshot percentages. If game sense takes first priority, delve into positioning heat maps and death locations. As your ability to read the data and make changes increases, gradually broaden statistical analysis to cover more and more subjects within your play style.
It is far more important to be consistent in tracking and reflecting on one’s game stats than to try and do everything at once. Every week set aside time to check your own performance data, observe trends and adapt practice regimes accordingly. At first the gains might appear slight here, there or anywhere yet eventually they will build up to significant improvements in skill.
The path to improvement is no longer mysterious. Advanced technology like the LORGAR PLATFORM makes it easy to understand your performance through detailed gaming analytics. You have everything necessary for tracking your gameplay over time, plus solid evidence and foundation to make systematic improvements. Use data like the pros do, as now you can too. Your next victory streak starts with understanding the numbers behind your gameplay, and the journey from casual to competitive begins with that first look at your statistics.